Monitoring serverless apps in real time is critical for ensuring performance, managing costs, and quickly resolving issues. Serverless environments are dynamic and distributed, making traditional monitoring methods less effective. Here's what you need to know:
Key Metrics to Track:
Performance: Function duration (<1,000ms), API latency (<100ms), cold start latency (<800ms).
Errors: Error rates (<0.1%), timeouts, HTTP error codes (4xx/5xx).
Resources: Memory usage (<80%), concurrent executions, and network I/O.
Challenges:
Cold starts, distributed tracing, and unpredictable resource usage require tailored tools.
Benefits:
Better performance, cost management, and faster troubleshooting.
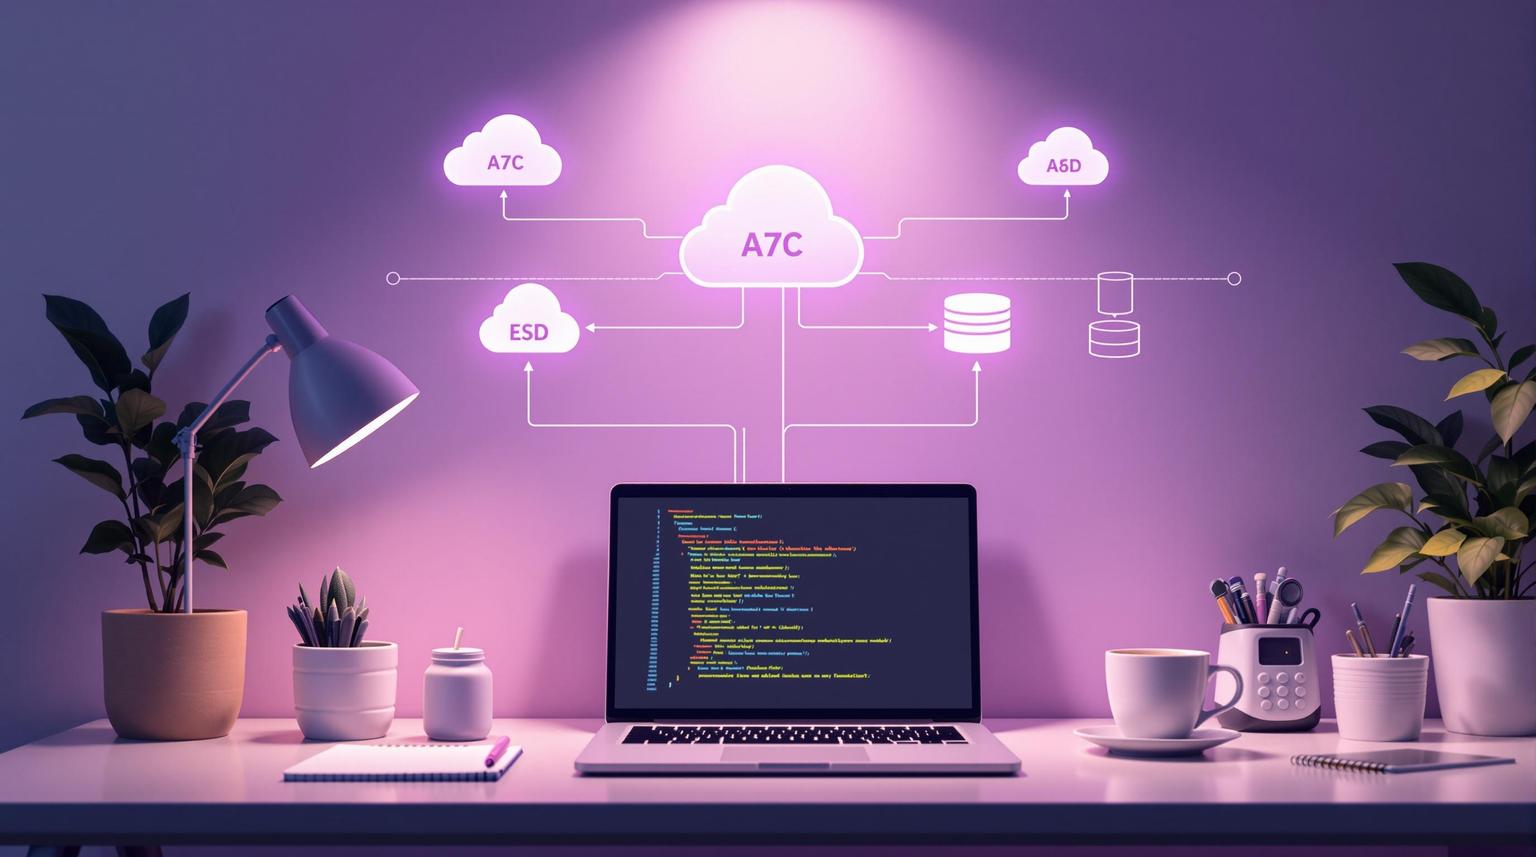
Tools like Movestax simplify monitoring by offering real-time dashboards, custom alerts, and resource optimization features. Start by tracking essential metrics, setting up alerts, and using dashboards to visualize performance. Use this data to identify bottlenecks, reduce costs, and improve reliability.
How to Monitor Serverless Apps
Essential Metrics to Track
When it comes to improving performance, keeping an eye on measurable metrics is key. Here’s a breakdown of the most important areas to monitor.
Speed and Response Times
How fast your functions execute directly affects user experience and costs. Use these metrics to measure and improve speed:
Metric | Description | Target Range |
|---|---|---|
Function Duration | Time from trigger to completion | Less than 1,000ms |
Cold Start Latency | Time for the first function to initialize | Less than 800ms |
API Gateway Latency | Time for routing and processing requests | Less than 100ms |
End-to-End Latency | Total time from request to response | Less than 2,000ms |
Movestax’s real-time dashboard tracks these metrics and sends alerts when thresholds are exceeded, helping you act quickly.
Error Tracking
Spotting and addressing errors early can save you a lot of trouble. Here are the key error metrics to monitor:
Function Error Rate: Measures the percentage of failed executions compared to successful ones. Keep this under 0.1%.
Timeout Frequency: Tracks how often functions run past their timeout limits, helping you fine-tune settings.
HTTP Error Codes: Monitor 4xx and 5xx errors to identify client-side or server-side problems.
Movestax simplifies troubleshooting by providing detailed error logs, complete with stack traces and contextual data.
Resource Usage
Efficient resource usage keeps costs down and ensures smooth performance. Focus on these metrics:
Resource Metric | Why It Matters | Optimization Goal |
|---|---|---|
Memory Usage | Affects both cost and performance | Stay below 80% of allocated memory |
Concurrent Executions | Shows scaling behavior | Balance cost with availability |
Function Invocations | Reflects usage trends | Optimize for steady throughput |
Network I/O | Impacts latency and expenses | Minimize unnecessary data transfers |
Movestax’s resource monitoring tools make it easy to spot patterns and adjust resources using clear, intuitive dashboards.
Selecting Monitoring Tools
Tool Selection Criteria
When picking monitoring tools for serverless applications, look for features that support effective real-time tracking. Here's a breakdown of key features to consider:
Feature | Description | Why It Matters |
|---|---|---|
Real-time Metrics | Collect and visualize live data | Allows immediate action on issues |
Custom Dashboards | Tailor displays for critical metrics | Keeps teams focused on relevant data |
Alert System | Set up flexible notification rules | Ensures prompt responses to problems |
Data Retention | Store historical data for analysis | Helps with trend identification and debugging |
Integration Options | Connect seamlessly with your tech stack | Simplifies setup and ongoing management |
Movestax Monitoring Features
Movestax offers a range of tools to help you monitor serverless applications effectively:
Real-time Performance Tracking: Keep an eye on function execution times, memory usage, and API response times through an easy-to-use dashboard.
Custom Alert Rules: Create specific thresholds for important metrics and get notified instantly when something goes wrong.
Resource Optimization: Analyze resource usage patterns to reduce costs and improve performance.
With Movestax, you can monitor your entire serverless setup from one dashboard. No need to juggle multiple tools - everything is in one place.
Tool Integration Steps
Follow these three steps to integrate monitoring tools seamlessly:
1. Configure Basic Metrics
Start by enabling core metrics tracking. This includes monitoring function executions, memory usage, API response times, and error rates.
2. Set Up Custom Metrics
Add application-specific metrics, such as performance of key endpoints, user experience (UX), and database responsiveness.
3. Establish Alert Rules
Define alert thresholds and set up alert channels like email, SMS, or Slack. Don’t forget to configure escalation paths and schedule maintenance windows for smoother operations.
Alert and Dashboard Setup
Once you've chosen your monitoring tools, the next step is setting up alert rules and dashboards to keep everything running smoothly.
Setting Alert Rules
Good alert rules help your team focus on real problems without being overwhelmed by unnecessary notifications. Here's a simple way to categorize alerts:
Priority | Response Time | Alert Channels | Example Triggers |
|---|---|---|---|
P1 (Critical) | < 15 minutes | SMS, Phone, Slack | Function crashes, API downtime |
P2 (High) | < 1 hour | Email, Slack | Memory usage > 85%, Response time > 1s |
P3 (Medium) | < 24 hours | Cold starts > 20%, Cost spikes |
When using Movestax, start by identifying baseline metrics. Knowing what "normal" looks like will help you avoid false alarms and keep your team focused on real issues.
Creating Clear Dashboards
Dashboards should give a quick, easy-to-read overview of your key metrics. Focus on these areas:
Performance Overview: Track function execution times, API response times, error rates, and active users.
Resource Utilization: Monitor memory consumption, CPU usage, network throughput, and cost trends.
Business Metrics: Keep an eye on transaction success rates, user engagement, service availability, and feature usage.
Movestax's dashboard builder allows you to customize views for different teams. Developers can zero in on technical details, while business teams can focus on user experience and cost data.
Team Alert Setup
To ensure your team responds quickly and efficiently, assign alerts based on roles:
Define Escalation Paths
Start with the on-call developer. If the issue isn't resolved, escalate it to senior engineers, and finally to management for critical problems.
Set Up Communication Channels
Match the alert priority to the right communication method:
Critical: SMS and phone calls
High: Slack notifications
Medium: Daily email summaries
Schedule Alert Windows
Use Movestax's scheduling tools to send alerts during work hours and suppress them during planned maintenance. This keeps your team focused and avoids unnecessary disruptions.
Using Data to Improve Performance
Once you've set up alerts and dashboards, the next step is putting your collected data to work to enhance performance.
Spotting Performance Issues
Your monitoring data can help you identify and address serverless performance bottlenecks. Here are key areas to focus on:
Functions with long execution times
High memory usage trends
Frequent cold starts
Elevated error rates
Deployment logs are especially useful for speeding up debugging.
"Movestax just simplified my app deployment workflow to minutes. Gone are the days of wrestling with infra setups. Loving the platform so far!" - Craig Schleifer (@bytebuster777)
Routine Performance Checks
To keep your system in top shape, establish a schedule for performance reviews:
Daily Health Checks
Monitor API response times, error rates, resource consumption, and cost trends.
Weekly Deep Dives
Examine function performance, resource scaling patterns, cost-saving opportunities, and user experience metrics.
Monthly Audits
Assess overall system architecture, resource allocation, and the balance between cost and performance.
Movestax Performance Tools
Movestax offers tools that take your monitoring strategy to the next level by automating issue detection and resolution.
"Movestax has completely transformed how I manage my projects. The integration of apps, databases, and workflows into one seamless ecosystem has saved me countless hours. Special shoutout to the deployment logs feature - it's an absolute lifesaver when debugging!" - Benjamin Thompson (@benzzz)
Here’s how Movestax tools can help:
Tool | Purpose | Impact |
|---|---|---|
Deployment Logs | Real-time debugging | Quick issue identification |
AI Agent | Infrastructure optimization | Automated performance tuning |
n8n Integration | Workflow automation | Less manual intervention |
Database Management | Resource optimization | Faster query performance |
"Shoutout to @Movestax for being the ultimate builder's toolkit. Deployed my app, set up Redis, and automated workflows all in one place." - Justin Dias (@pixelGenius)
Summary and Action Items
Key Monitoring Points
For successful real-time serverless monitoring, focus on these areas:
Monitoring Area | Key Metrics | Suggested Actions |
|---|---|---|
Performance | Response times, execution duration | Reduce cold starts by optimizing performance |
Resources | Memory usage, CPU utilization | Keep an eye on scaling patterns |
Reliability | Error rates, availability | Set up automated alerts to catch issues early |
Cost | Resource consumption, execution frequency | Optimize resource usage to manage costs effectively |
Use these metrics as a guide when setting up Movestax's monitoring tools.
Start with Movestax
Movestax offers an integrated toolset to simplify the monitoring process. Here's how to get started:
Set Up Your Environment
Deploy your app using Movestax's user-friendly interface. This automatically configures basic monitoring and provides instant access to performance metrics.
Configure Advanced Monitoring
Enable advanced features to monitor database performance, workflow execution, resource use, and API response times.
Automate Workflows
Use Movestax's n8n integration to automate responses to alerts, minimizing the need for manual intervention.
Further Learning
Take your skills further by exploring these areas:
Infrastructure Management
Leverage Movestax's AI Agent to interpret monitoring data and identify areas for improvement.
Database Optimization
Learn how to use database management tools to enhance query performance and make better use of resources.
"Movestax just simplified my app deployment workflow to minutes. Gone are the days of wrestling with infra setups. Loving the platform so far!" - Craig Schleifer (@bytebuster777)
"Movestax has completely transformed how I manage my projects. The integration of apps, databases, and workflows into one seamless ecosystem has saved me countless hours. Special shoutout to the deployment logs feature - it's an absolute lifesaver when debugging!" - Benjamin Thompson (@benzzz)
"Shoutout to @Movestax for being the ultimate builder's toolkit. Deployed my app, set up Redis, and automated workflows all in one place." - Justin Dias (@pixelGenius)