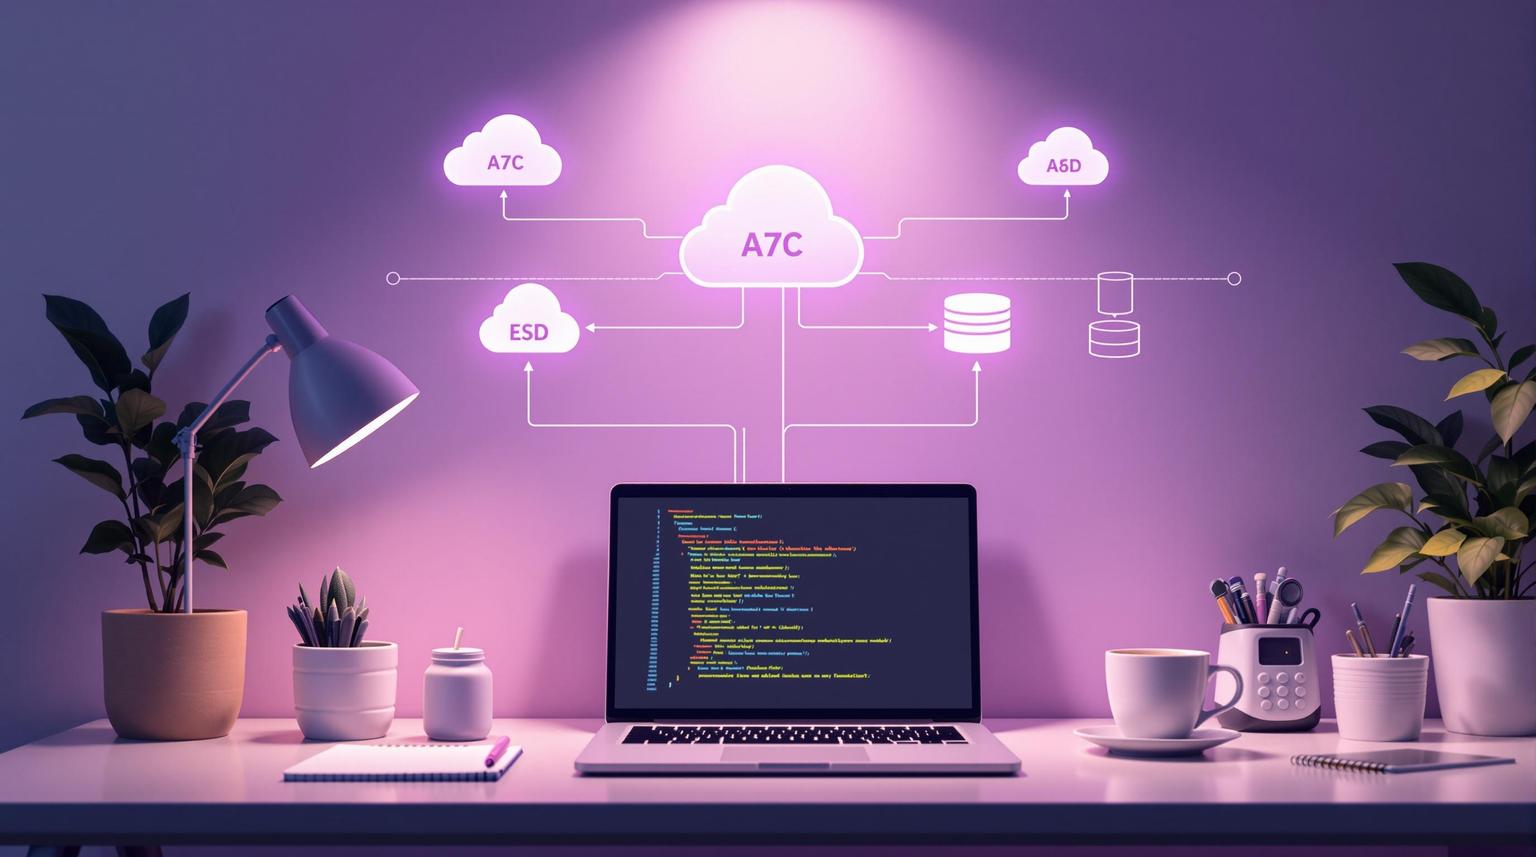
Serverless computing simplifies application deployment but comes with unique challenges like short-lived executions, cold starts, and distributed services. Monitoring performance effectively requires tailored strategies. Here’s a quick summary of best practices:
Set Up Complete Logging
Use structured logging (e.g., JSON format) for easier analysis.
Implement correlation IDs to track requests across functions.
Use log sampling to reduce storage costs in high-traffic environments.
Leverage Distributed Tracing
Track request paths across services with tools like OpenTelemetry.
Focus on metrics like response time, throughput, and error rates.
Use sampling methods to manage tracing data costs.
Track Key Metrics
Monitor invocation latency, error rates, memory usage, and cold starts.
Set thresholds to detect issues early and manage costs.
Reduce Cold Start Delays
Optimize memory allocation, deployment packages, and runtime choices (e.g., Node.js or Python for faster initialization).
Monitor initialization time and dependency load times.
Set Up Automatic Alerts
Use tools like AWS CloudWatch to monitor metrics like errors and latency.
Configure alerts for cost anomalies and performance issues.
Focus on Security Monitoring
Apply least privilege access and monitor failed authentication attempts.
Use real-time alerts for security threats and unusual patterns.
Use Third-Party Tools
Monitor and Control Costs
Track metrics affecting costs like execution time and invocation frequency.
Optimize resource allocation and reduce unnecessary invocations.
Review and Update Regularly
Adapt your monitoring tools and strategies as your application evolves.
Conduct regular reviews to refine performance, cost, and security measures.
Quick Comparison of Monitoring Tools
Tool | Type | Key Features | Best For | Pricing |
|---|---|---|---|---|
AWS CloudWatch | Native AWS | Metrics, logs, basic tracing | AWS-heavy environments | Pay-per-use |
Datadog | Commercial | AI-powered analytics, service discovery | Large organizations | Premium pricing |
Lumigo | Serverless-focused | Distributed tracing, auto-monitoring | Enterprise pricing | |
SigNoz | Open-source | Full-stack observability, dashboards | Teams preferring open-source | Free or pay-as-you-go |
AWS re:Invent 2024 - Observing serverless applications (SVS212)
1. Set Up Complete Logging and Log Collection
Getting your logging system right is the backbone of monitoring serverless performance. Without detailed logs, it’s nearly impossible to debug problems or track performance in environments where functions execute briefly and then vanish.
Logging and Tracing Techniques
To overcome the unique challenges of serverless environments, you need to adopt logging and tracing practices that go beyond the basics.
Structured logging is a must for serverless applications. Instead of relying on plain text logs, use JSON format to make logs easier to analyze. This structured approach allows monitoring tools to automatically parse the log data, saving time and effort.
Correlation IDs are another powerful tool. These unique identifiers tie together log entries from the same request or process, letting you trace the entire execution path across multiple serverless functions. To maintain visibility, pass these IDs to all downstream systems.
Log levels are essential for managing log verbosity. Use levels like "error", "warning", "info", and "debug" to categorize log entries. In production, stick to logging only critical entries to keep costs under control.
Log sampling can help in high-traffic environments. By sampling logs, you capture critical data without overwhelming your storage systems.
Centralized Logging and Metrics
Centralized logging platforms are critical for serverless applications. They help preserve transient function data and give you a unified view of your application’s performance and behavior.
For AWS users, CloudWatch Logs Insights is a great option. It automatically detects values in JSON logs, making it easier to filter and query data. This feature pairs perfectly with structured logging, streamlining your ability to analyze serverless performance.
Every log entry should include contextual metadata - like timestamps, request IDs, user information, and function details. This extra context is invaluable when troubleshooting issues or identifying performance bottlenecks.
Log retention policies are another factor to consider. While historical data can be useful, serverless architectures can generate massive volumes of logs. Balance your storage costs with your operational and compliance needs by setting clear retention periods.
Security and Access Control
Logging isn’t just about performance monitoring - it’s also a vital part of security. Comprehensive logs create an audit trail that helps detect security incidents and meet regulatory requirements.
"Effective logging and monitoring allow you to not only detect and respond to security incidents in real-time but also maintain an audit trail that can help meet regulatory and compliance requirements." - Sergey Dudal
To keep logs secure, restrict access to sensitive information. Avoid logging sensitive data in plain text, and ensure proper access controls are in place so only authorized individuals can view or analyze logs.
Real-time log analysis is another critical feature. By analyzing logs as they’re generated, you can quickly detect security threats or performance anomalies. Configure alerts based on specific patterns or error rates to address issues before they significantly impact users.
In serverless environments, where functions terminate almost immediately, centralized and well-structured logs are your best tool for achieving full visibility. With effective logging practices, you’ll be better equipped to diagnose performance issues and fine-tune your serverless deployments.
2. Use Distributed Tracing for Full System Visibility
Distributed tracing provides a detailed map of how each request travels through your serverless architecture. This becomes especially important in complex setups where a single user action might trigger multiple functions across various services. Essentially, it builds on the groundwork laid by robust logging, offering a more connected and comprehensive view.
Logging and Tracing Capabilities
Distributed tracing tracks a request from its starting point through every service it interacts with, creating a visual representation of its execution path. Unlike traditional logging, which captures isolated events, tracing connects these events, showing how different components of your serverless app work together.
The process relies on three key elements: traces, spans, and context propagation. A trace captures the complete path of a request, while spans represent individual tasks or operations within that trace - essentially, the time each service spends handling the request. Context propagation ensures these spans remain connected as the request moves through distributed services.
To make distributed tracing effective, it’s crucial to include a standardized set of details in all events. These details might include the event source, type, timestamp, and a correlation ID (like a trace identifier). The CloudEvents specification, developed by the Cloud Native Computing Foundation, offers a standard way to describe event data across serverless functions.
OpenTelemetry has become the go-to framework for instrumentation, offering both manual and automatic tracing capabilities. Automatic instrumentation reduces manual errors and ensures consistent tracing across your serverless environment.
Monitoring Tools and Metrics Coverage
Once you’ve nailed down the basics of tracing, the next step is selecting tools that can measure performance and costs effectively. Both open-source and commercial options are available, each with its strengths. Here’s a quick comparison of some popular tracing tools:
Tool | Type | Key Features | Best For | Pricing |
|---|---|---|---|---|
SigNoz | Open-source/Cloud | Full-stack observability, custom dashboards | Teams seeking open-source with cloud options | Free (open-source), Pay-as-you-go (cloud) |
Open-source | Service dependency analysis, adaptive sampling | Large-scale distributed systems | Free | |
Commercial | Comprehensive APM suite, real-time analytics | Mid to large-sized businesses | Tiered pricing, free tier available | |
Commercial | High-cardinality analysis, BubbleUp | Teams debugging complex systems | Tiered pricing |
When monitoring your system, focus on metrics such as response time, throughput, and error rate. For example, even a two-second delay can cause 90% of mobile users to abandon a site. Pay close attention to critical workflows like logins and transactions.
Cost Optimization Strategies
Distributed tracing can produce a lot of data, so keeping costs under control is essential. Two common strategies are head-based sampling and tail-based sampling. Head-based sampling selects traces at the start of a request, while tail-based sampling decides which traces to keep after all spans are collected. The latter is especially useful for serverless applications, as it prioritizes traces that highlight errors or performance issues over routine traffic.
Adding meaningful metadata to your traces, such as customer segments, geographic regions, or request types, can also improve filtering and analysis while keeping data volume manageable.
Security and Access Control Features
Distributed tracing isn’t just about performance - it also offers security benefits. By creating a complete audit trail of request flows, it can help detect anomalies like spikes in latency or error rates, which could indicate security threats or performance problems.
Tracing also aids in dependency mapping, revealing how services interact and exposing hidden dependencies. This insight can uncover vulnerabilities, such as sensitive data flowing through unexpected paths within your serverless setup.
For example, Movestax, with its serverless-first architecture that includes instant app deployment and managed databases, benefits greatly from distributed tracing. These practices help visualize and optimize complex request flows, ensuring clarity and performance across its architecture.
3. Track Key Performance Metrics and Set Limits
Keeping an eye on key performance metrics and setting clear thresholds is crucial for avoiding unexpected hiccups and managing costs effectively. Without a solid understanding of how your system behaves, you’re leaving yourself open to performance issues and budget surprises.
Monitoring Tools and Metrics Coverage
To assess the health of your system, monitor metrics like invocation latency, execution duration, error rates, cold start frequency, memory usage, and CPU utilization. The so-called "golden metrics" - request volume, latency, faults, and errors - offer a structured way to gauge your system’s overall performance and reliability.
A great example of how monitoring tools are evolving is Amazon CloudWatch Application Signals, introduced in November 2023. This AWS solution streamlines application performance monitoring by automatically linking metrics, traces, and logs. The result? Faster troubleshooting and fewer disruptions to your applications.
Some companies are already seeing the benefits of such capabilities. Take New10, for instance. Their Engineering Manager, Pavel Kruhlei, shared:
"Datadog reduces the MTTR when we have incidents in our serverless environment by correlating critical metrics like Lambda executions and timeouts with traces and logs across functions, containers, and hosts in a single platform."
Once you’ve got the right metrics in place, it’s time to focus on managing costs while maintaining performance.
Cost Optimization Strategies
Tracking cost metrics is just as important as monitoring performance to avoid inefficiencies and surprise expenses. Start by establishing baseline metrics during the initial testing and deployment phases. With these baselines, you can set alerts for deviations that flag potential problems early. Performance testing is another critical step - it helps you uncover scalability issues before they affect production.
Design tests to simulate both peak and sustained loads, which can reveal how your application handles provider limits like execution timeouts or concurrency caps. For instance, test scenarios that trigger cold starts or evaluate auto-scaling by gradually increasing the load. Analyzing memory usage patterns will also help you fine-tune function sizing and better predict operational costs.
But monitoring isn’t just about performance and cost - it’s also a key part of ensuring reliability and security.
Security and Access Control Features
Monitoring tools aren’t just for keeping your app fast and cost-effective - they’re also essential for maintaining reliability and security. A good monitoring system can catch errors before they impact users, allowing you to fix issues quickly and keep service quality high. Setting thresholds for performance metrics doesn’t just optimize costs; it also helps stabilize your system. Budget alerts can flag sudden cost spikes, which might signal a security breach, while tracking unusual patterns in resource usage or function invocations adds an extra layer of protection.
For platforms like Movestax, which operates with a serverless-first architecture supporting instant app deployment and managed databases, comprehensive metric tracking is non-negotiable. Managing interconnected serverless components - like databases (PostgreSQL, MongoDB, Redis) and workflows - requires monitoring strategies that account for this complexity. This unified approach ensures that Movestax’s components run smoothly and securely.
With the serverless computing market expected to grow at an annual rate of 22.6% by 2028, and AWS Lambda accounting for about 77% of the serverless function market, it’s clear that robust monitoring practices are a must for any serious serverless deployment.
4. Reduce Cold Start Delays
Cold starts happen when a serverless function runs for the first time or after a period of inactivity. While they affect less than 0.25% of AWS Lambda requests, they can still disrupt the user experience when they occur.
Monitoring Tools and Key Metrics
To tackle cold start issues, start by identifying latency using monitoring tools. These tools can highlight functions with prolonged initialization times. Pay attention to these critical metrics:
Initialization Time: Aim for under 200ms
First Byte Time: Keep it below 300ms
Total Response Time: Target less than 800ms
Memory Usage: Stay within 256MB
Dependency Load Time: Keep it under 100ms
Tracking these benchmarks helps pinpoint slow functions and measure the impact of optimizations. AWS Serverless Hero Allen Helton notes:
"Cold starts are very real in the serverless world, but they aren't a problem in most cases."
Use the data from monitoring tools to set up cold start alerts. For example, configure alerts to trigger when initialization times exceed your defined thresholds. Tools like CloudWatch can provide basic insights through the Init Duration parameter, while more advanced platforms offer detailed views, such as tables showing "Functions with the Most Cold Starts".
Once you have a clear understanding of your cold start metrics, you can shift your focus to implementing cost-effective solutions to reduce delays.
Strategies for Cost and Performance Optimization
Improving performance doesn’t just reduce delays - it can also help manage costs. For instance, the choice of programming language plays a big role in cold start duration. Java, for example, is about seven times slower to initialize than .NET, which is the second slowest runtime. If you’re creating new functions, consider using Node.js, Python, or Go, which typically experience cold starts in the 200–400 millisecond range. In contrast, Java and C# often take 500–700 milliseconds.
Another approach is increasing memory allocation. While this can speed up cold starts, it may also raise per-invocation costs.
To further reduce latency, streamline deployment packages. Tools like Webpack can minimize dependency sizes, leading to faster initialization. Additionally, AWS Lambda Layers can help by managing common dependencies separately, which reduces the size of your main deployment package.
Security and Access Control Impact on Performance
Performance isn’t just about speed - it’s also about secure configurations. For example, Virtual Private Cloud (VPC) setups can extend cold start durations due to Elastic Network Interface (ENI) setup times. If your functions don’t need VPC access, removing this configuration can significantly improve performance.
Be mindful of function chaining, where one Lambda function invokes another. This practice can compound cold start delays. Monitoring these patterns ensures you’re not unintentionally slowing down your system.
For companies like Movestax, which rely heavily on serverless-first architectures to handle workloads across PostgreSQL, MongoDB, and Redis, minimizing cold starts is critical. Their architecture supports instant app deployment and managed databases, so seamless performance hinges on reducing these delays.
AWS Lambda can provision up to 6,000 execution environments per minute in each AWS Region. If you notice a sudden spike in cold starts, it could signal a scaling event that requires further investigation. Regularly evaluating cold start patterns, using the monitoring practices discussed earlier, helps distinguish between normal scaling and potential issues.
5. Set Up Automatic Alerts and Response Plans
Automatic alerts are like your system’s early warning siren, designed to catch problems before they snowball into major customer issues. By combining these alerts with solid performance monitoring and tracing practices, you can tackle problems as soon as they arise.
Monitoring Tools and Key Metrics
The first step is deciding which metrics need your immediate attention. Metrics like invocations, errors, cold starts, memory usage, and duration are critical to monitor. However, not all metrics are equally useful for triggering alerts.
For example, when setting up error rate alerts, you can use CloudWatch metric math to calculate error percentages and set thresholds aligned with your Service Level Agreements (SLAs). For latency alerts, relying on percentile statistics (like p90, p95, or p99) gives you a better sense of user experience than simple averages, which can hide performance spikes.
To get more specific, enable detailed CloudWatch metrics in API Gateway. This allows you to monitor issues at the method level, helping you pinpoint the exact endpoints causing trouble instead of triggering broad system-wide alerts.
If your functions are connected to streaming data sources, keep an eye on the IteratorAge metric for Kinesis or DynamoDB streams. This metric shows how far behind your function is in processing data, giving you an early heads-up on potential bottlenecks.
Additionally, tools like the Serverless Framework come with built-in monitoring to catch anomalies and send alerts automatically. For more advanced options, platforms like Lumigo can provide pre-configured alerts for functions that are auto-traced.
Keeping Costs in Check
Smart alerting doesn’t just protect performance - it also helps you avoid unexpected costs. Monitoring everything can get expensive, so it’s important to strike a balance between thoroughness and cost efficiency.
One way to manage this is by codifying your alert setups using tools like cloudwatch-alarms-macro. You can also set up cost-based alerts to flag when spending exceeds predefined thresholds. Focus on metrics that tie directly to both performance and cost. For instance, monitoring function duration can help you spot inefficient code that’s driving up execution time, while memory usage alerts can reveal over-provisioned functions wasting resources.
This strategy helps you catch problems like runaway functions or sudden traffic spikes before they lead to expensive surprises, creating a direct link between cost management and system performance.
Security and Automated Responses
Response plans should include automated actions to resolve security incidents quickly. Using AWS EventBridge rules and Lambda functions, you can automatically isolate failures and maintain availability across VPC subnets .
For example, you can configure EventBridge to monitor changes in API Gateway execution states. If a status changes to "FAILED", an automated remediation Lambda function can isolate the affected resources and start recovery procedures immediately.
It’s also crucial to understand function retry behavior. Make sure your functions are idempotent, meaning they can handle retries without causing unintended side effects during incident responses.
For platforms like Movestax, which manage PostgreSQL, MongoDB, and Redis in a serverless-first environment, automated security responses are critical. These systems need to isolate problems fast while still keeping services available.
Lastly, always have a fallback plan for when functions fail. This might include backup authentication methods or alternative ways to access data, ensuring that legitimate users aren’t locked out while you work on resolving the issue.
6. Focus on Security Monitoring and Access Control
Serverless security takes a different approach compared to traditional models. With serverless adoption surging from 30% in 2020 to 53% in 2022, the need for specialized security monitoring has become more pressing. These core principles lay the groundwork for effective security practices in serverless environments.
Security and Access Control Features
In serverless systems, security begins at the function level. Unlike traditional setups where an entire system is secured, serverless architectures demand that each individual function is safeguarded.
One key strategy is enforcing the principle of least privilege for each function, which can reduce breaches by 40%. Multi-Factor Authentication (MFA) is another essential layer, capable of blocking 99.9% of automated attacks. Dynamic access control further enhances security by adjusting permissions based on factors like user risk, login behavior, and activity patterns. This approach helps in detecting and flagging anomalies quickly.
Monitoring Tools and Metrics Coverage
Effective serverless security also relies on robust monitoring. Beyond tracking performance, it’s crucial to monitor security metrics such as failed authentication attempts and unauthorized access. Real-time monitoring and alert systems play a pivotal role in identifying potential threats early. Organizations that implement comprehensive monitoring strategies have reported notable reductions in security incidents.
Logging and Tracing Capabilities
Logs are a cornerstone of security visibility. Make sure to maintain well-structured logs, including application, access, and audit logs, to support quick correlations and anomaly detection.
In complex serverless architectures, distributed tracing becomes indispensable. This method creates visual maps that reveal how security events move through interconnected services. Adding annotations to these traces can highlight security-related performance metrics and key business transactions.
Finally, isolating development, staging, and production environments with dedicated IAM roles ensures that incidents remain contained.
Security Control | Implementation | Benefit |
|---|---|---|
Function-Level Permissions | Minimize IAM roles per function | 40% reduction in security breaches |
Multi-Factor Authentication | Enable MFA for all access | Blocks 99.9% of automated attacks |
Dynamic Access Control | Context-based permission adjustment | Real-time threat response |
Environment Separation | Isolated dev/staging/production | Limited incident scope |
7. Use Third-Party Monitoring Tools
While native cloud tools provide a good starting point, third-party monitoring tools take things to the next level. They offer a comprehensive view of serverless applications, tackling the unique challenges of distributed architectures. With these tools, you gain advanced features that enhance your ability to monitor, analyze, and optimize both performance and costs.
Monitoring Tools and Metrics Coverage
Third-party tools excel at delivering real-time insights into serverless application performance. They track crucial metrics like function duration, error rates, invocation counts, cold start frequencies, and resource usage (e.g., CPU and memory). Beyond this, they also capture business-oriented metrics, giving you a complete understanding of your application’s health. Without these tools, developers can waste up to 65% of their time due to a lack of proper visibility and instrumentation. Many platforms also include features like anomaly detection, customizable dashboards, and seamless integration with major serverless platforms and DevOps pipelines.
Logging and Tracing Capabilities
One standout feature of third-party tools is their ability to consolidate fragmented logs into actionable insights. Distributed tracing, for example, is a game-changer. Many tools offer simple transaction wrappers that automatically link logs and trace IDs, making it much easier to pinpoint issues across complex systems. Additionally, log-based alerts notify teams of specific error patterns, helping to address problems quickly.
Cost Optimization Strategies
Beyond performance monitoring, these tools are invaluable for cost management. They highlight inefficiencies that native tools might overlook, such as misconfigured functions that waste resources. By unifying spending views, they make it easier to identify and fix these issues.
"Serverless monitoring is also a crucial tool that allows ITDM and BDM to monitor serverless spending. The ability to understand how many resources are being used at a given time enables businesses to scale up or down as needed and control spending." – Elastic.co
Some platforms use AI-driven algorithms to optimize resource allocation automatically, reducing costs while boosting efficiency. For instance, these tools can help cut AWS spending by up to 50% through automated adjustments. When choosing a monitoring tool, look for one that integrates seamlessly with your current setup and offers detailed insights into individual function performance. This level of granular visibility is key to controlling costs effectively.
Comparing Key Features Across Tool Categories
Tool Category | Key Benefit | Cost Impact |
|---|---|---|
Multi-Cloud Platforms | Unified spending visibility | Up to 50% cost reduction |
AI-Powered Optimization | Automated resource adjustment | Continuous efficiency gains |
Function-Level Monitoring | Granular performance insights | Targeted cost optimization |
These advanced tools, such as those integrated with platforms like Movestax, ensure your serverless applications consistently perform at their best while keeping costs in check.
8. Monitor and Control Costs
Managing serverless costs requires a thoughtful approach since expenses are directly tied to factors like function invocations, execution time, and memory usage. Keeping a close eye on these elements through effective monitoring is key to avoiding budget surprises and improving efficiency. Below, we’ll explore tools and strategies to help you stay in control of your serverless spending.
Monitoring Tools and Key Metrics
The foundation of cost management lies in tracking the right metrics. Focus on execution time, invocation frequency, and error rates - these directly affect your bill and can reveal areas for improvement. For instance, cutting function invocations by 15% could save over $20,000 annually. Companies that actively tracked resource usage reported reducing operational costs by up to 25% within six months.
"Real-time monitoring is essential to manage costs effectively in serverless environments. Set up dashboards to track metrics like execution time, invocation frequency, and error rates. Automated alerts for unusual usage patterns help teams stay ahead of cost anomalies, preventing unexpected charges." - Tania Fedirko
Here’s a quick comparison of popular monitoring tools and their cost-saving capabilities:
Monitoring Tool | Key Features | Average Cost Savings |
|---|---|---|
AWS CloudWatch | Automated alerts, usage analytics, dashboards | Up to 20% |
Azure Monitor | Performance tracking, alert configuration, visual insights | Up to 25% |
Google Cloud Operations | Traffic insights, usage reports, efficiency recommendations | Up to 30% |
Strategies for Cost Optimization
Once you’ve established a solid monitoring system, use those insights to implement cost-saving strategies. Start with right-sizing your functions. By analyzing each function’s memory and timeout needs, you can eliminate waste. Over 30% of compute resources in cloud setups are often underutilized, highlighting the savings potential in proper resource allocation.
Streamlining invocation patterns is another key tactic. Techniques like event batching and caching can significantly cut down on the number of function calls. For high-volume applications, this is essential - API calls, for example, can cost up to $3.50 per million executions.
Reducing data transfer costs is also critical. Minimize cross-region transfers and prioritize local storage options. A great example of this is the Happy Path application, which reduced file sizes by 98-99% through image optimization, slashing both data transfer and CloudFront expenses.
Code optimization can deliver additional savings. Here’s how different strategies can reduce execution time:
Strategy | Potential Time Savings |
|---|---|
Code Optimization | 15-30% |
Reduce Package Size | 10-20% |
Avoid Unnecessary Operations | 20-35% |
Leverage Asynchronous Programming | 25-50% |
Use JIT Compilation | 20-80% |
When it comes to architecture, smarter choices can make a big difference. For instance, Amazon API Gateway’s HTTP APIs are about 70% cheaper than REST APIs. Similarly, storing binary data in S3 is often more cost-efficient than using databases, and DynamoDB can be a more economical option compared to RDS.
Platforms like Movestax take cost control a step further by integrating monitoring into serverless infrastructure management. They provide real-time spending insights and automated recommendations, helping developers address inefficiencies before they escalate.
Finally, regular cost audits are a must for long-term savings. Set up automated alerts to catch unexpected usage spikes, and periodically review your configurations to eliminate inefficiencies and unused resources. Keep an eye on logging as well - excessive logs can inflate costs by nearly 30%.
9. Review and Update Performance Regularly
Serverless monitoring isn't something you can set up once and forget about. As your applications grow and evolve, regular reviews are essential to keep performance smooth and oversight effective.
Monitoring Tools and Metrics Coverage
Your monitoring setup needs to adapt as your applications expand. Serverless functions, like AWS Lambda, can scale up or down rapidly to meet changing demand. This dynamic nature means your monitoring tools must be capable of keeping up with these shifts.
When conducting reviews, focus on four key areas: application logs, access logs, control plane audit logs, and performance metrics. These elements form the backbone of effective serverless monitoring.
Evaluate whether your current tools are still meeting your application's needs. For example, AWS Lambda integrates with CloudWatch for basic monitoring, but tools like Epsagon or Lumigo provide more advanced insights. As your application grows in complexity, you may need to transition to more sophisticated solutions that offer deeper observability.
Unlike traditional systems, serverless environments are dynamic and short-lived, which makes real-time monitoring critical. Regular reviews ensure your tools remain aligned with your workload, providing insights that help refine costs and enhance security.
Cost Optimization Strategies
Performance reviews should also include a close look at your monitoring costs and efficiency. Are you paying for features you no longer need, or missing opportunities to streamline? Adjust configurations to eliminate inefficiencies while maintaining visibility.
Fine-tune alert thresholds to reduce false positives and ensure critical issues are detected promptly. If your monitoring setup requires frequent manual adjustments, it might be time to explore automation. Automated tools can scale effortlessly with your application's size and complexity. This not only saves time but also ensures consistent performance as your environment grows.
Improving cost efficiency through these steps allows you to allocate resources more effectively, while regular reviews also help identify areas for security improvements.
Security and Access Control Features
As your application evolves, so do the security challenges it faces. Regularly updating your security logging and alerts is crucial to staying ahead of potential threats. Ensure access logging is enabled for all public-facing APIs, S3 buckets, and CloudFront distributions.
Activate CloudTrail across all AWS regions to capture every control plane event. Comprehensive logging becomes even more important as your team grows and more people access your infrastructure. Set up alarms for critical control plane actions, like changes to IAM roles or security groups.
Keep an eye on Lambda errors, API Gateway latency, and DynamoDB throttling to identify performance or security issues early. AWS Config can help verify that your resources comply with your organization's security policies, adapting as compliance requirements change.
Make it a habit to review findings in AWS Security Hub regularly. Address high-priority issues quickly to maintain a secure environment. By consistently analyzing your monitoring data and alerts, you ensure that your security strategy evolves alongside your application.
Movestax simplifies these processes by integrating monitoring insights, making it easier to review and maintain performance and security as your environment grows and changes.
Comparison Table
The table below outlines the key differences in strengths, pricing, and features of the monitoring solutions discussed. Use this to choose a tool that aligns with your technical requirements, budget, and operational goals.
Tool/Platform | Strengths | Best For | Pricing Range | Features |
|---|---|---|---|---|
Movestax | AI-driven cost optimization, unified platform | Developers, startups, SMBs | $0-$105/month | Smart auto-scaling, cost optimization engine, integrated monitoring for databases and workflows |
AWS CloudWatch + X-Ray | Native AWS integration, comprehensive metrics | AWS-heavy environments | Pay-per-use | Deep AWS resource monitoring, distributed tracing for debugging applications |
Lumigo | Serverless-focused monitoring | Pure serverless applications | Enterprise pricing | Full distributed tracing, effortless serverless monitoring, quick root cause identification |
Datadog APM | AI-powered analytics, enterprise features | Large organizations | Premium pricing | Automatic service discovery, AI anomaly detection, comprehensive root cause analysis |
Last9 | Simplified visualization, minimal setup | Kubernetes environments | Mid-range pricing | Combined trace and metric visualization, pre-built dashboards for common services |
Dynatrace | All-in-one enterprise solution | Large enterprises | High-end pricing | AI-driven distributed tracing, proprietary OneAgent technology, comprehensive observability |
For cost transparency, CloudZero provides granular breakdowns by service, function, and even individual invocations. It also offers real-time insights and anomaly detection.
If you're just starting with serverless monitoring, native AWS tools like Cost Explorer, AWS Budgets, and Cost Anomaly Detection are free and straightforward options. While they work well for simpler setups, they may lack the advanced capabilities required for more complex environments.
Ultimately, the decision often comes down to balancing integration complexity with feature depth. Movestax stands out with a 5.0/5 overall rating, excelling in ease of use (5.0/5) and support (5.0/5), while maintaining strong features (4.5/5). This makes it an excellent choice for teams seeking a streamlined, all-in-one monitoring solution without the hassle of managing multiple tools.
Effective serverless monitoring relies on real-time metrics, custom dashboards, alerts, data retention, and seamless integration. The right solution will strike a balance between these features and your team's expertise and budget. Movestax’s unified platform simplifies monitoring by integrating your apps, databases, and workflows, making it a compelling option for comprehensive performance management.
Conclusion
Adopting these nine best practices lays a strong groundwork for effective serverless performance monitoring, which can boost both your bottom line and the overall user experience. The serverless computing market is growing fast, with a projected compound annual growth rate (CAGR) of 23.17% by 2028.
Companies have reported up to a 30% increase in efficiency and customer retention, alongside noticeable reductions in resource waste and downtime. Regular testing and updates to monitoring tools help identify vulnerabilities and maintain system reliability. These measurable outcomes highlight why solutions like Movestax are gaining traction for simplifying monitoring in complex serverless setups.
Movestax stands out as a robust option for serverless monitoring, earning a perfect 5.0 rating. Principal Software Engineer Rodrigo S. shares his experience:
"Overall I do recommend using Movestax, it's easy, good price, performance is amazing and support always when you need it."
Movestax integrates key monitoring elements - logs, performance metrics, and cost controls - into a single, user-friendly platform, aligning seamlessly with these best practices.
As serverless architectures continue shifting from fixed costs to usage-based pricing models, proactive monitoring becomes even more essential. These strategies ensure that your applications not only stay operational but also perform optimally, manage costs effectively, and scale effortlessly in an ever-competitive environment.
FAQs
What are the best ways to reduce cold start delays in serverless applications?
Reducing cold start delays in serverless applications is key to improving both performance and user satisfaction. Here are a few practical ways to achieve this:
Schedule regular invocations to keep functions warm. This prevents them from going idle, ensuring they're ready to handle requests quickly during high-demand periods.
Streamline your code and dependencies by trimming down your deployment package. Include only the libraries and files you actually need, which helps cut down initialization time.
Increase memory allocation for your functions. Often, more memory translates to faster startup times. Experiment with different memory settings to strike the right balance between cost and performance.
Using these strategies, you can ensure your serverless applications respond faster and provide a smoother experience for your users.
What metrics should I track to ensure my serverless applications perform well and stay cost-efficient?
To keep your serverless applications running smoothly and efficiently, it's crucial to monitor a few key metrics:
Invocation Count: This tells you how often your functions are triggered, giving you a clear picture of usage trends and patterns.
Execution Duration: Tracks how long it takes for your functions to complete. Longer runtimes can lead to higher costs, so keeping this in check is important.
Error Rate: Measures the percentage of failed executions. A high error rate might point to problems in your code or configuration that need fixing.
Cold Start Latency: This is the delay that occurs when a function is invoked after being idle. It can directly affect user experience, so minimizing it is key.
Memory Usage: Shows how much memory your functions consume during execution. Monitoring this helps you adjust resource allocation for better performance and cost control.
Paying attention to these metrics can help you spot performance issues, use resources more effectively, and keep costs under control in your serverless setup.
How can third-party monitoring tools improve serverless performance monitoring over built-in cloud tools?
Third-party monitoring tools can take serverless performance monitoring to the next level by offering features that often surpass what built-in cloud tools provide. One of their standout benefits is the ability to offer a centralized view of serverless applications, even when they span across multiple cloud platforms. This makes it much simpler to oversee and analyze performance from a single place.
These tools also bring advanced capabilities like AI-powered analytics and customizable dashboards. With these, you can pinpoint performance bottlenecks, spot anomalies faster, and set up alerts tailored to your specific needs. The result? Faster troubleshooting and more reliable serverless applications. By using these solutions, developers can gain a deeper understanding of their environments and maintain greater control over their performance.